The Great Illusion of the Market: Inflation and its Real Impact on your FIRE Plan
When we begin our path toward Financial Independence and Early Retirement (FIRE), it is common to look for validation in the historical behavior of the stock markets. We look at graphs from past decades, we see lines that rise exponentially and we feel the peace of mind that, in the long term, the stock market always rises. However, financial markets have a very particular way of presenting information, creating optical illusions that can be fatal if we do not understand them thoroughly.
If you’ve been looking at how to grow your wealth so you’re no longer dependent on a salary, you’ve probably come across promises of astronomical returns. But to ensure your financial independence without fail, we must talk about the biggest long-term portfolio killer: the chasm between nominal return and real return.
Analyzing the Gap: The Red Line Mirage
To understand the magnitude of this problem, it is enough to observe the behavior of the most followed stock market index in the world, the S&P 500, over a century.
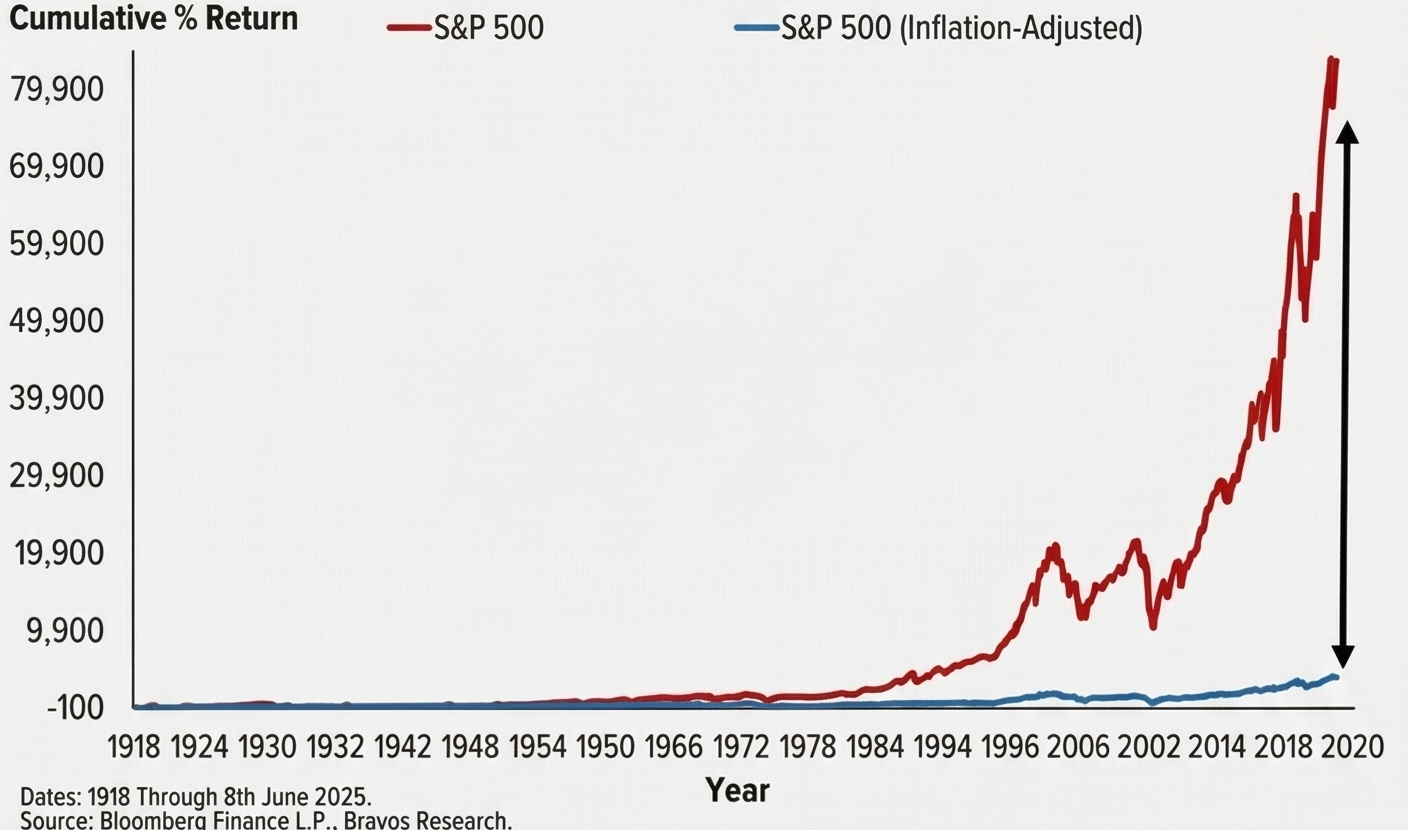
The chart provided illustrates the performance of the S&P 500 from the year 1918 to June 8, 2025. At first glance, the trajectory is astonishing:
- A red line represents the growth of the index, skyrocketing exponentially and approaching the 79,900% profitability mark.
- This astonishing figure is what we know as nominal return, that is, the gross number of dollars (or euros) in your account without any type of economic context.
Any investor who sees only that red line would think that accumulating wealth is as simple as sitting back and waiting. But the real story is told at the bottom of the chart.
- A blue line, drawn almost flat and attached to the lower coordinate axis, shows us the same S&P 500, but adjusted for inflation.
- A huge black vertical arrow visually highlights the gigantic gap between nominal returns (the red line) and real purchasing power (the blue line) after more than a century of history.
This visual representation is a bath of frozen reality. That 79,900% growth does not mean that today you can buy 800 times more houses, cars or food than in 1918. It means, to a large extent, that the currency has lost its purchasing value, and the stock market has acted as a life raft to float above that constant devaluation.
The Silent Devourer of your FIRE Number
In the financial independence community, the main goal is to reach a point where passive income from your investments covers all of your living expenses. This means that your retirement plan does not depend on accumulating bills, but on accumulating purchasing power.
This is where the concept of inflation comes into play, that silent devourer that erodes the purchasing power of your money. Historically, the stock market (such as the S&P 500) has delivered an annualized return close to 10%. However, once we subtract the effect of inflation to obtain the adjusted or real return, that figure drops to a historical 7%.
If you build your financial plan looking only at the red line (10%), you will be making a catastrophic miscalculation. You might mistakenly believe that you need much less startup capital to retire. Your early retirement plan must necessarily assume that life will be noticeably more expensive in two or three decades.
The 4% Rule and Economic Reality
The mathematical pillar of the FIRE movement is the 4% Rule, born from the famous Trinity Study. This study determined that, historically, if you withdraw 4% of your portfolio in your first year of retirement and subsequently adjust that amount annually by adding inflation, the money should last at least 30 years.
Have you ever wondered why the rule is 4% and not 7% or 10%? Precisely because of what the blue line graph shows us. The 4% rule incorporates a massive safety cushion to absorb the blows of inflation and ensure that your ability to pay remains intact, even when bread or electricity costs three times as much as today.
The Perfect Storm: Inflation + Market Crashes
If planning for constant inflation is already a challenge, the real danger comes when it is combined with bearish periods in the markets. This is the worst mathematical nightmare for anyone who lives off their portfolio: Sequence of Returns Risk (SoRR).
The market does not offer you a comfortable and predictable 7% real each year. There will be years where inflation soars and markets fall. If this high-inflation, bear-market scenario occurs during the first few years of your retirement, you will be forced to sell more of your (now cheap) investments to cover living expenses that are suddenly much more expensive. Selling depreciated assets to pay inflated bills can deplete your portfolio prematurely, causing irreversible structural damage.
This damage is almost impossible to recover, even if financial markets experience strong rebounds in the following years. That’s why basic compound interest calculators, which project a straight line into the sky, are insufficient and dangerous for planning an early retirement over 40 years.
How to Protect your Wallet and Overcome Illusion
The good news is that the flat blue line is no reason for despair; It is a call to rigorous planning. To make your journey to Financial Independence a success, you need robust tools that stress your portfolio against volatility and real inflation.
To answer the question of whether you will run out of money early, financial planners use advanced simulation tools that test your portfolio against the worst possible conditions. The two star methodologies are:
- Pure Monte Carlo Simulation: Uses mathematical statistics and chance to generate thousands of unordered sequences of returns. It is based on the mean return and standard deviation to create alternative worlds where your portfolio must survive.
- Historical Mode (Bootstrapping): Uses real returns and historical inflation data month by month and year by year, reflecting real chaos, recessions and proven correlations between the stock market and the cost of living.
Any rigorous financial planner will tell you that you should use both methods for maximum peace of mind. The historical method anchors you to the reality of the worst past crises, while Monte Carlo prepares you for combinations of inflation and crashes that we have not yet witnessed.
Don’t leave the most valuable asset in your life—your time—at the mercy of a graphic illusion. We strongly invite you to use our free Monte Carlo simulator. In it you can switch between real historical data and pure statistical simulations. You will be able to stress your portfolio to the maximum and check if your withdrawal strategy is truly resistant to currency devaluation, ensuring that your money grows both on the red line and in the real world.
Do the numbers, plan for the worst economic scenario and, with the peace of mind that mathematics gives, prepare to enjoy the best of your retirement.
Calculate your FIRE number
Find out if your portfolio would survive the worst crises in history with our free Monte Carlo calculator.
Try the simulator