S&P 500 in Election Years: Why Political Noise is a FIRE Opportunity
- The Anatomy of a Midterm Year: Volatility and Uncertainty
- The Spring Effect: Historical Recoveries (1 Yr. Forward Return)
- Years of great impact and their rebound
- What Does This Mean for your FIRE Plan?
- 1. If you are in the Accumulation Phase (Savings and Investment)
- 2. If you are in the Retirement Phase (Living off your Investments)
- Conclusion: Data Defeats Fear
We are in the middle of 2026, a year marked by the midterm elections (the famous midterms) in the United States. If you turn on the television or read the financial press, you will notice an unmistakable pattern: alarmist headlines, analysts predicting the collapse of the economy and a general feeling of uncertainty in global markets.
For the traditional investor, this political noise generates panic, leading them to make the worst possible mistake: selling their assets at the worst time. However, if you are on the path to Financial Independence and Retire Early (FIRE), your approach must be radically different. Followers of the FIRE movement do not base their decisions on fear or the politics of the day, but on the coldness of mathematics and the history of the markets.
What really happens to the world’s main index, the S&P 500, during these periods of high electoral tension? If we look at historical data for more than seventy years, we will discover that volatility is not a defect of the system in these years, but rather a predictable and, above all, highly profitable characteristic if you know how to manage it.
The Anatomy of a Midterm Year: Volatility and Uncertainty
Financial markets hate uncertainty above all else. During a midterm election year, control of the US Congress and Senate is often at stake, meaning future fiscal, regulatory and economic policies are up in the air. This lack of clarity causes nervousness, which translates into capital withdrawals and temporary falls in the stock market.
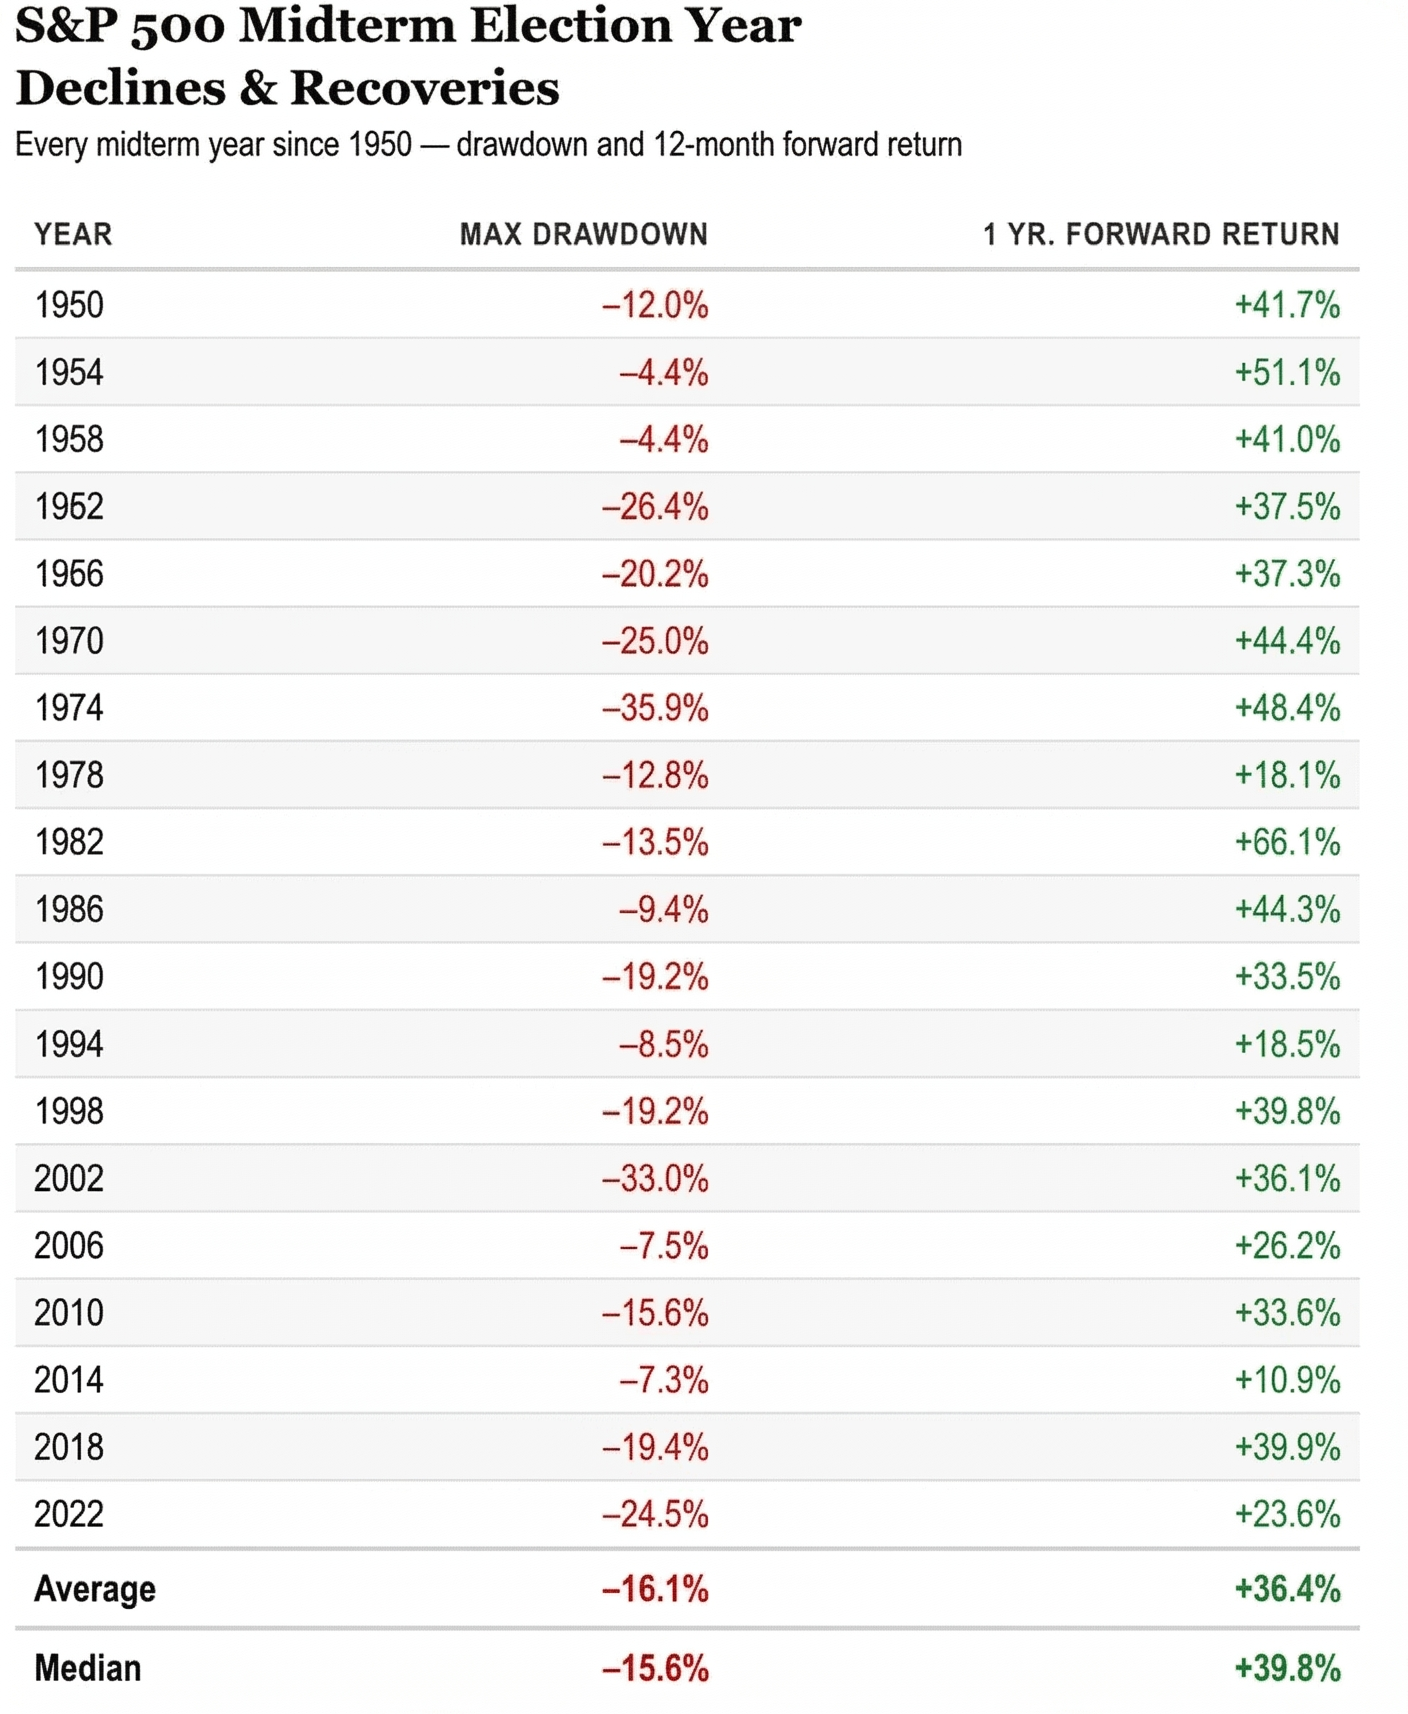
If we analyze the performance of the S&P 500 in every midterm election year since 1950, the pattern of decline is evident. Intra-month drawdowns or “Max Drawdowns” (the percentage loss from the highest point to the lowest point of that year) are significant.
- The average maximum drop in these election years is -16.1%.
- The median maximum retracement is -15.6%.
Seeing your portfolio shrink by 16% in a matter of months is not easy to digest. It is at these times that the most fragile FIRE plans fall apart due to psychological stress. However, to isolate this fact is to see only half of the film. What happens immediately after these declines is what really accelerates wealth creation.
The Spring Effect: Historical Recoveries (1 Yr. Forward Return)
Once the political landscape becomes clearer—regardless of which party wins—uncertainty dissipates. The market is once again focusing on company fundamentals, corporate profits and the real economy. And the reaction of the stock market is usually spectacular, acting like a spring that has been strongly compressed.
The history of 12-month returns (1 Yr. Forward Return), counted from the market lows in these years, shows us a strong bullish force:
- The average positive return over 12 months is a staggering +36.4%.
- The median one-year return is even higher, reaching +39.8%.
To understand the magnitude of this “rebound effect”, just look at some of the most dramatic years in recent economic history:
Years of great impact and their rebound
- 1962: The market suffered a severe drawdown of -26.4%, but in the following 12 months it achieved a return of +37.5%.
- 1974: In the midst of the oil crisis and stagflation, the fall was brutal, reaching -35.9%. However, the return to a later year was +44.4%.
- 2002: After the burst of the DotCom bubble and the ravages of 9/11, the market fell -33.0%, then recovered a solid +36.1% the following year.
- 2022: More recently, in an environment of high inflation and aggressive interest rate hikes, we saw a peak decline of -24.5%, which was followed by a 12-month return of +23.6%.
Even in years where the declines were much milder, such as 1954 (-4.4%) or 1958 (-4.4%), subsequent returns were extraordinary, standing at +51.1% and +41.0% respectively. The historical lesson is clear: betting against the S&P 500 after the shocks of a midterm year has been, statistically, a losing decision.
What Does This Mean for your FIRE Plan?
Understanding this statistical dynamic is essential depending on the phase of the journey towards Financial Independence you are in.
1. If you are in the Accumulation Phase (Savings and Investment)
If you’re still working and investing monthly, a midterm year is your best friend. Falls of 15% or 20% are not a crisis, they are Black Friday sales in the stock market.
Maintaining your regular contribution strategy (Dollar Cost Averaging) during these months of uncertainty means that you will be buying shares of index funds at much lower prices. When the subsequent historical recovery occurs (that average of +36% one year ahead), those cheap contributions will be the ones that generate the most explosive returns for your capital thanks to the power of compound interest.
2. If you are in the Retirement Phase (Living off your Investments)
This is where the story gets a little trickier. If you have already left your job and depend on selling small portions of your portfolio to cover your expenses (applying the 4% Rule), these episodes of volatility introduce a real danger: Sequence of Returns Risk (SoRR).
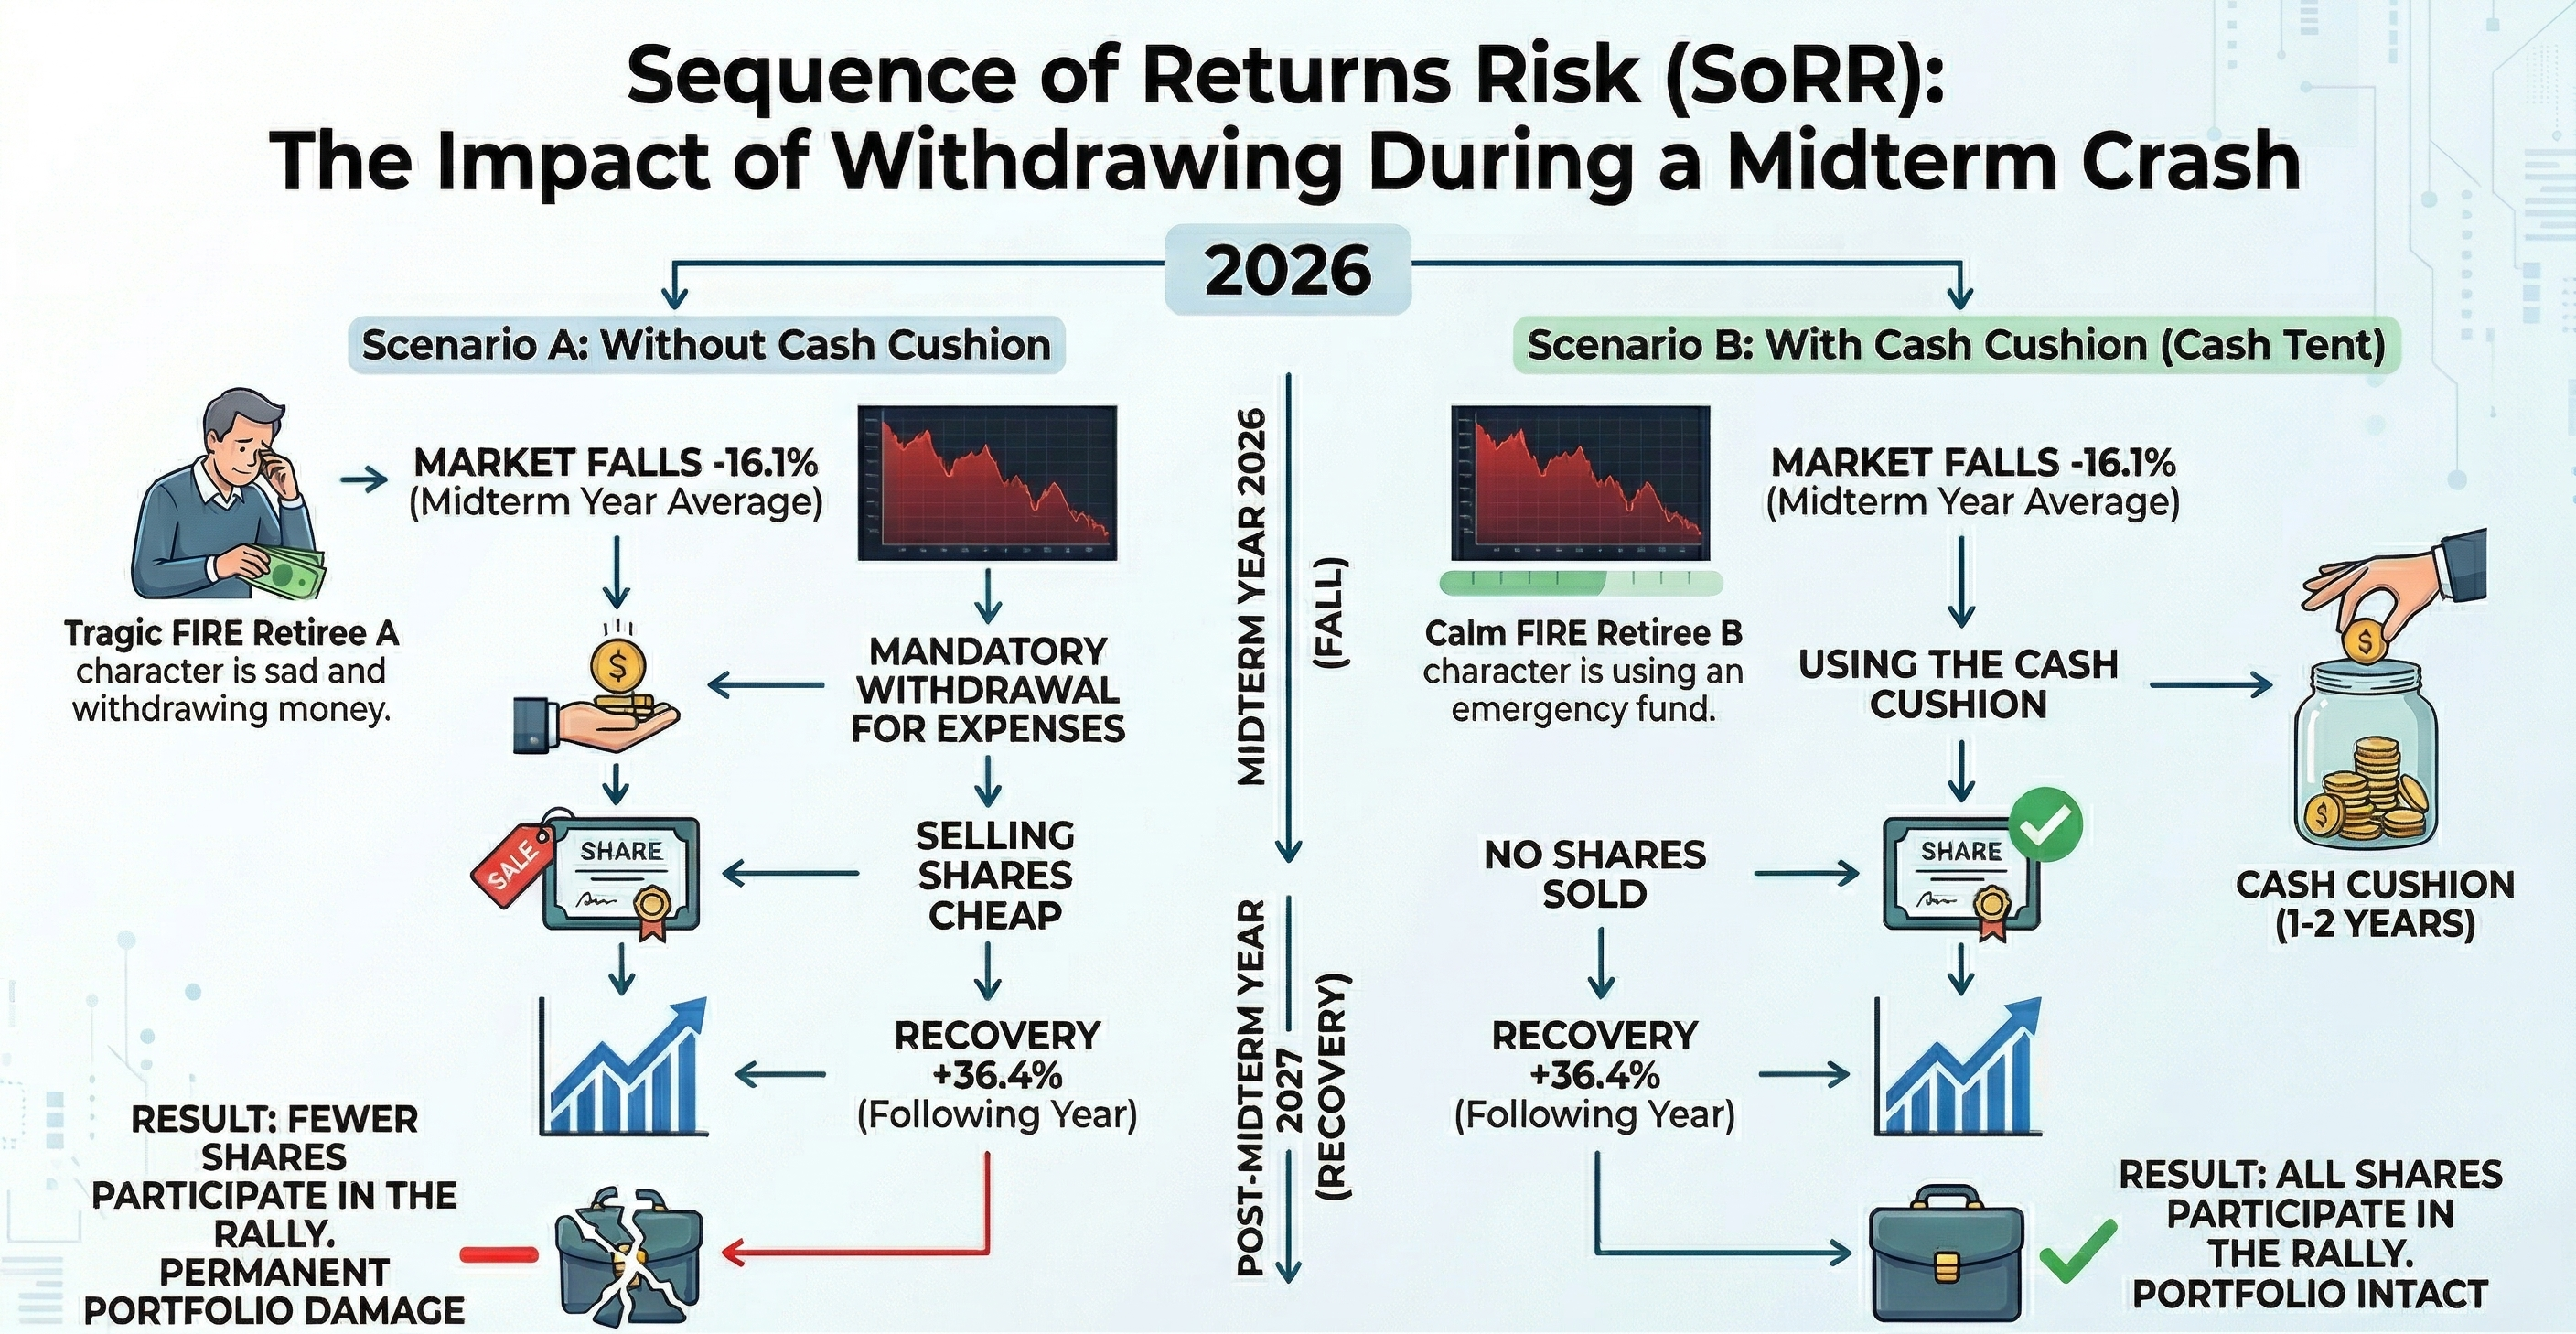
If the average -16% drop in an election year coincides with your early retirement years, being forced to sell your cheap stocks to pay for rent or food will cause permanent damage to your portfolio. By the time of next year’s rapid recovery, you’ll have fewer shares in your account to share in that growth.
To protect yourself, experienced FIRE investors use strategies such as a “cash cushion” (cash tent) equivalent to 1 or 2 years of expenses, or flexible withdrawal strategies, thus avoiding selling at the bottom of the well caused by electoral uncertainty.
Conclusion: Data Defeats Fear
As we move into 2026 and the political headlines get louder, remember the historical chart we just reviewed. Since 1950, absolutely all midterm years evaluated recorded a positive 12-month return after hitting bottom.
Your financial success will not depend on who wins the election, but on your ability to ignore the noise, keep a cool head, and stick to your investment plan.
If you’re worried about how a severe decline (like the -35.9% in 1974) might affect your current withdrawal rate, don’t leave things to chance. We invite you to use our free Monte Carlo simulator. With it, you can stress your portfolio against these and many other real historical declines, mathematically ensuring that your FIRE plan is election, recession, and global crisis-proof.
Turn off the news, review your numbers, and let the markets, long-term, continue to work their magic.
Calculate your FIRE number
Find out if your portfolio would survive the worst crises in history with our free Monte Carlo calculator.
Try the simulator