Monte Carlo vs. Historical Data: Which is best for your FIRE Plan?
- The Danger of Averages and Sequence of Returns Risk
- What is Pure Monte Carlo Simulation?
- Advantages of Pure Monte Carlo
- Disadvantages of Pure Monte Carlo
- What is History Mode (Bootstrapping)?
- Advantages of Historical Mode
- Disadvantages of Historical Mode
- Key Differences: Statistics vs. Reality
- Which one should you use for your FIRE strategy?
Achieving Financial Independence and Retire Early (FIRE) is one of the most exciting milestones you can achieve. However, the moment you decide to leave your job and start living off your investments, a question arises that keeps more than one person awake at night: Will I run out of money before my time?
To answer this big question, financial planners don’t use a simple compound interest calculator. They use advanced simulation tools to stress your portfolio against the worst possible conditions.
If you’ve started tinkering with retirement calculators, you’ve probably come across two heavyweights in portfolio survival analysis: Pure Monte Carlo Simulation and Historical Mode (or Bootstrapping).
At first glance, both methods try to predict the future of your money, but they do so speaking completely different languages. Understanding this difference is vital to designing a bulletproof withdrawal strategy.
The Danger of Averages and Sequence of Returns Risk
Before we get into simulations, we need to understand why we need them. If the stock market (like the S&P 500) has historically returned 10% annualized (7% adjusted for inflation), why not just subtract your expenses from that 7% and assume your money will grow forever?
The answer is called Sequence of Returns Risk (SoRR).
The market doesn’t give you a constant 7% every year. One year it rises 20%, the next it falls 15%, then it rises 5%. If you retire just before a severe bear market (like in 1929, 2000, or 2008) and are forced to sell your cheap stocks to pay your living expenses, your portfolio will suffer structural damage from which it may never recover, even if the markets rebound years later.
This is where simulations come in: their job is to test your portfolio against thousands of messy, chaotic sequences to see if it survives.
What is Pure Monte Carlo Simulation?
The Monte Carlo simulation owes its name to the famous casino city, and its logic is based purely on mathematical statistics and chance.
In a pure Monte Carlo model, the simulator does not know what the Great Depression or the DotCom crisis is. Only know two numbers about your portfolio:
- The expected average profitability (e.g. 7%).
- Volatility or standard deviation (e.g. 15%).
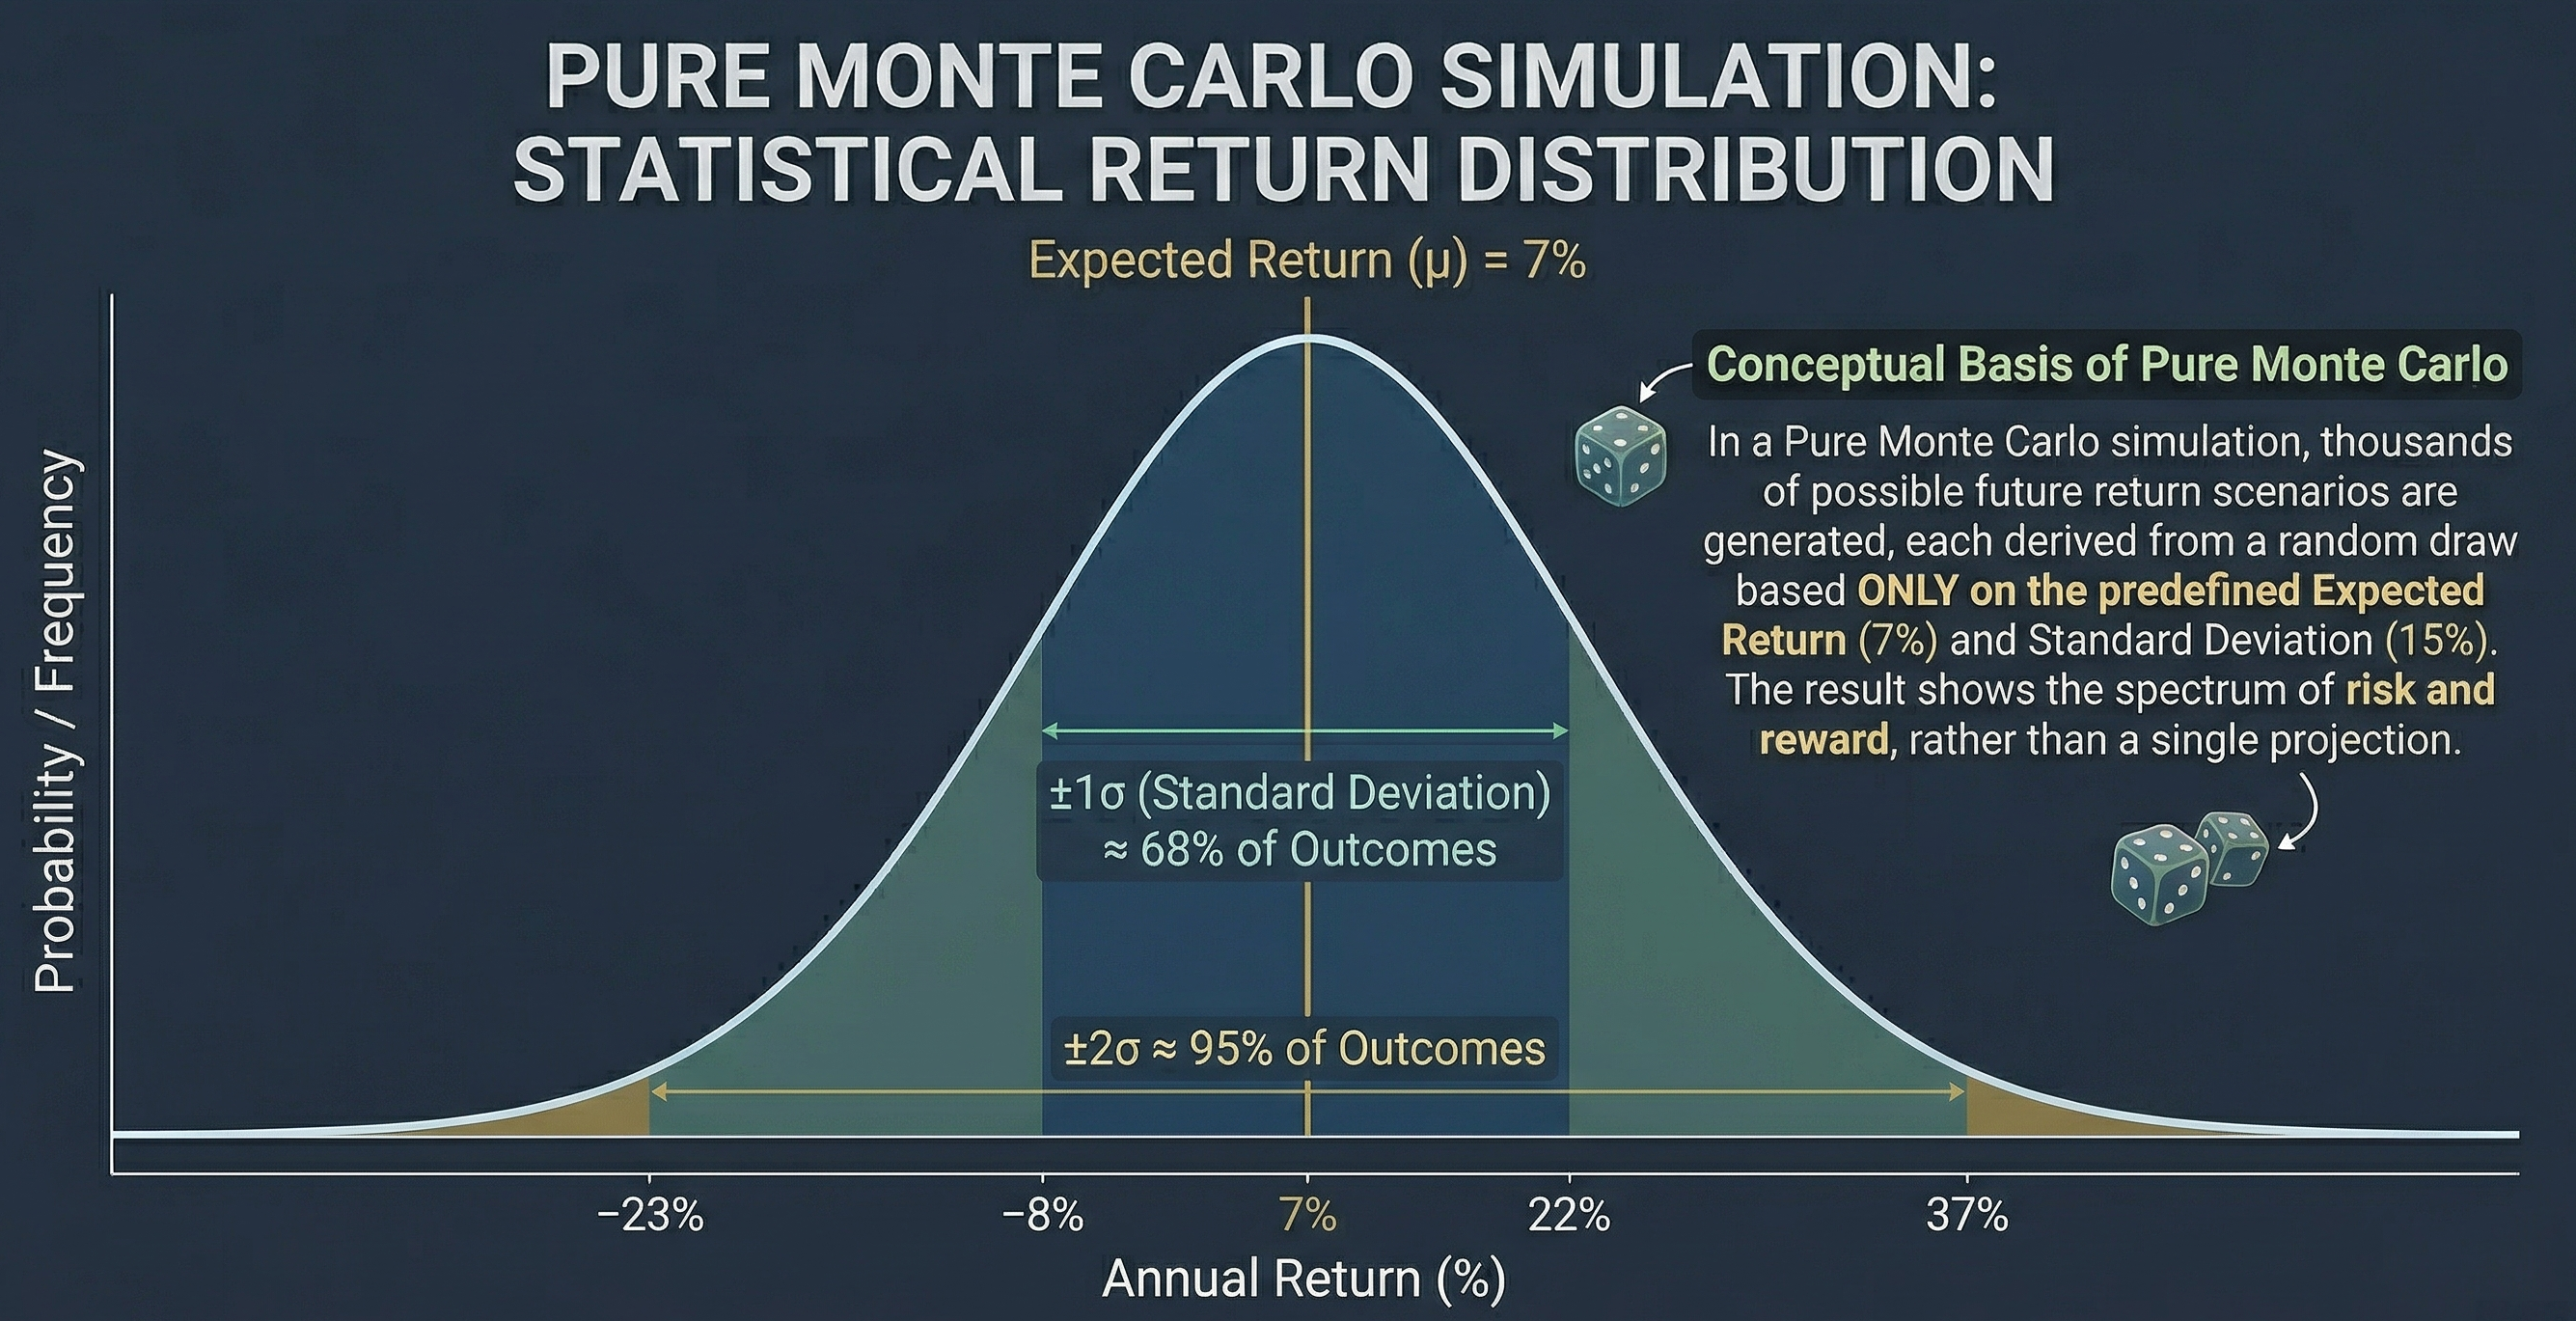
With these two pieces of information, the algorithm creates a “Gaussian bell” (a normal distribution) and begins rolling some virtual dice. For each year of your retirement, draw a random return from that distribution. Sometimes he will get +22%, sometimes -12%.
It repeats this process thousands of times, creating thousands of alternative lives for your portfolio, and in the end it gives you a success rate: “In 95% of the simulations, you didn’t run out of money.”
Advantages of Pure Monte Carlo
- Create scenarios that have never happened: Human history is limited. Monte Carlo can generate combinations of bad years that are statistically possible but that we have not yet experienced, preparing you for the unknown.
- Absolute flexibility: It allows you to project new assets (such as cryptocurrencies) that do not have 100 years of history, simply by estimating their average and volatility.
Disadvantages of Pure Monte Carlo
- Assume a “Normal” distribution: Real financial markets have “fat tails”. Extreme and catastrophic events occur more frequently in reality than traditional Monte Carlo statistics predict.
- Ignore market valuations: Monte Carlo doesn’t care if the market is very expensive or very cheap in year 1 of your retirement; its randomness is blind to the economic context.
What is History Mode (Bootstrapping)?
If Monte Carlo is a mathematician throwing dice, Historical Mode is a relentless historian.
Instead of using abstract statistical formulas, this method uses the database of actual month-to-month and year-to-year market returns (generally from 1871 or 1926 to today).
There are two main ways to apply historical data:
- Analysis of Sequential Cycles: The simulator “retires” you in each month of each historical year. What would have happened if you had retired in January 1966, just before a decade of severe stagflation? Figure out that exact timeline of 30 or 40 years. Then you retire in February 1966, and so on.
- Bootstrapping (Historical Sampling): It is a hybrid. It takes all the actual historical years and puts them in a hat. Then you draw one year at random (e.g. 1974 performance), then put it back in the hat and draw another (e.g. 1999). Thus it creates new chaotic timelines, but built with bricks of reality.
Advantages of Historical Mode
- Reflects psychology and real chaos: Historical data contains real inflation, real recessions, and real correlation between stocks and bonds during crises. It assumes nothing; It shows you what really hurt.
- Capture momentum and valuations: Pure historical sequences maintain the order of bull and bear markets, respecting how periods of high overvaluation often precede real declines.
Disadvantages of Historical Mode
- The future is not the past: Just because the American market behaved in a certain way in the 20th century does not guarantee that the 21st century will be the same. Limiting ourselves to history can blind us to new types of economic crises.
- Limited data sample: We have only about 100-150 years of reliable modern stock market data. That’s too few full 40-year retirement periods to draw firm conclusions.
Key Differences: Statistics vs. Reality
To summarize it simply:
- Data origin: Monte Carlo generates artificial returns based on a mathematical formula. Historical Mode recycles returns that actually occurred in the past.
- Inflation management: In Monte Carlo, inflation is usually set as a fixed number (e.g. 3% annually) or follows its own statistical distribution. In Historical Mode, if the simulator takes the year 1980, it will apply exactly the 13.5% inflation and the market return for that specific year, preserving the correlation between the two.
- Sense of security: Overcoming a difficult historical cycle (such as the crisis of the 1970s) usually gives the FIRE investor more psychological peace of mind than overcoming an abstract statistical scenario, because it puts a face and name to the crisis that your portfolio has just survived.
Which one should you use for your FIRE strategy?
The answer from any rigorous financial planner is simple: You should use both.
Historical Mode anchors you to proven economic reality. It assures you that your Secure Withdrawal Rate (SWR) would have survived the worst wars, pandemics and depressions of the last century. It is your fundamental litmus test.
On the other hand, the Monte Carlo Simulation protects you against complacency. It warns you that the future could bring a combination of inflation and market crashes that we haven’t yet seen in the history books, and forces you to maintain an adequate margin of safety.
So you don’t have to choose, we invite you to use our free Monte Carlo simulator. In it you will be able to play with both methodologies, alternating between statistical rigor and the weight of history, to stress your portfolio to the maximum and ensure that, no matter what happens, your journey towards Financial Independence is a resounding success.
At the end of the day, your peace of mind is worth much more than any mathematical formula. Do the numbers, plan for the worst and enjoy the best!
Calculate your FIRE number
Find out if your portfolio would survive the worst crises in history with our free Monte Carlo calculator.
Try the simulator